Wednesday 22 September 2021

Azure Synapse Intro

I have not done any serious big data work in many years and I'm using this post to understand the Azure options and update my skills.   

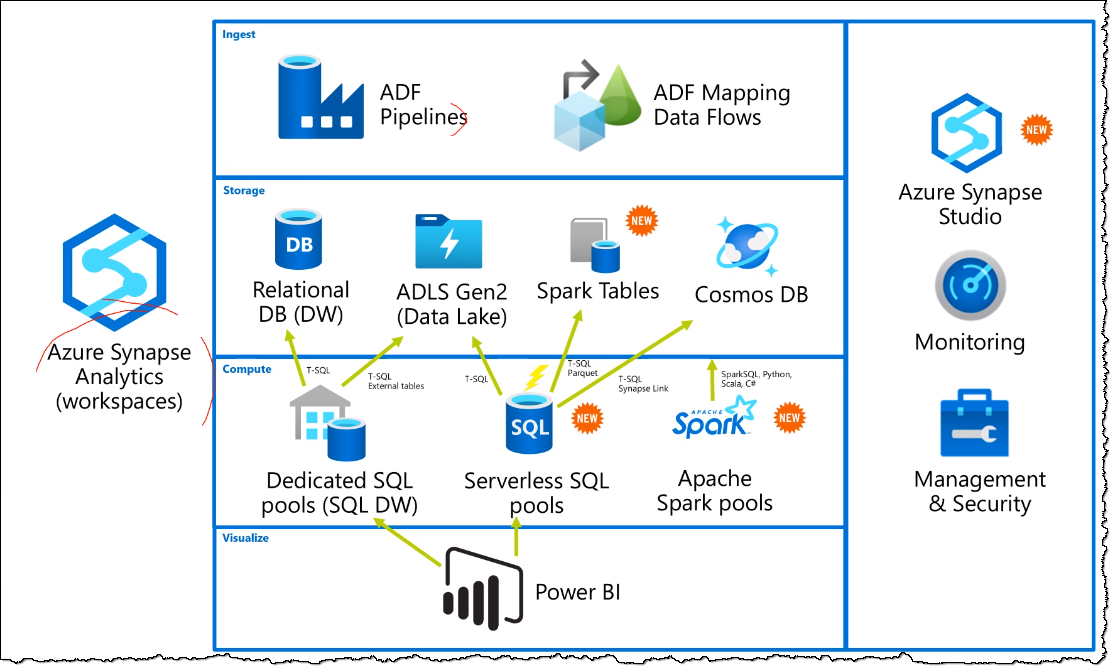
Azure Synapse Analytics - built for limitless scale for unstructured and structure data for big data  - supports petabyte analytics.  Ingest and prepare data for BI.  Instance can be a dedicated or serverless PaaS service.  Data lake Gen 2 assigned to each synapse instance.  GA Dec 2020.


Use to be Data Lake (massive, semi structured data) and Data warehouse, Azure Synapse Analytics can be referred to as Data Lakehouse.  Basically all the sperate pieces are under 1 umbrella i.e. ADF, SSIS, Dataware house,..
  • SQL Serverless Pools is pay be use/pay per query.  Can use SSMS to manage data.  Good for small or new data ware housing.  T-SQL works perfectly so simple for smaller projects or PoCs. 
  • Go from 3NF in relational data to using Fact and dimension tables to put data into a star model for MPP.
  • Data Warehouse Units (DW) - Same as DTU, made up of CPU, Mem, IO.  Simple to upgrade.  Lowest is DW100 can be huge, and simple to scale up and down.  More DW's means more VM's/work process work on the data.

Azure Synapse Studio  - SaaS development experience provide code free and code first (C#, Scala, Python, SQL, Java), notebooks are used for working with data.


Wednesday 8 September 2021

Observability in Azure SaaS Solutions

Problem:  Software has many places where errors and tracing is logged to.   Support get an incident, they need to investigate figure out how widespread the issue is and then try patch together various logs to figure out the problem.

Thoughts:

Observability is not a new concept, we need to be able to: 1) view and connect logs & 2) tracing and view metrics & notifications.

Implementing Observability must cover:

CI/CD allows devOps teams to find issues early using Unit testing.   Automated testing on UI.  API automation testing is also great.

Azure offers continious monitoring by performing various API calls to ensure your servie is running and any failures are picked up hopefully before any customers are aware.  You can also be notified of performance slow down, check performance speed between releases.  Which is great for identifying bottlenecks and with the Azure PaaS world, it is easy to increase the processing causing the bottleneck.  

Performance metrics built into the CI/CD and developers work allows us to identify issues early and costs miles less to correct early. 

Security and LINTing in CI/CD also allows us to pickup issues early and correct at a way lower cost.

Instrument you hardware and software, well on Azure you can use App Insights and you have a fantastic instrumenting platform that captures events.  A big reason to use Azure Services for as many of the function pieces in your solution.

Work In Progress ...

TBC Azure App Insights detail, ParentOperationId, Linking operations with a ServiceBus or work process call.


Sunday 5 September 2021

R&D UK tax Credits for Software development

Overview: R&D incentive claims with HMRC are designed to attract and encourage investment in R&D in the UK.  By providing for a taxable credit at 13% on qualifying expenditure, namely: Staff costs, consultants, Software licenses, hosting.  Claiming R&D costs reduces the companies tax liability and can be attractive for starting a new business or building new SaaS products.

The idea is:

PoC, Concept Design, software design and initial testing are likely to be deemed as probably qualifying for R&D claims.  The product/service must seek to advance (new or appreciable improvement of a process, product or increase technical capability) technology.

Specification/Requirements, scale up to commercial release, training may be qualifying activities. 

Thoughts:  R&D relief claims are complex.  There are different rates for SME vs large corps and rates if the company is in profit.  It is worth doing, and I believe it is pretty common to pay experts based on a percentage of R&D claim.  The big players have divisions to do R&D claims, i.e. KPMG.  There are also tons of specialized smaller firms that will do R&D claims.  For a SaaS startup, I'd contact a specialist provider to make the R&D claims and agree to a fixed percentage of the savings.

Wednesday 18 August 2021

Creating a Power Platform Custom Connector from a Postman Collection

Problem:  I like to discover an API and play with it using Postman.  I save the collection and theoretically I should be able to upload the postman collection into the custom connector to generate the Power Platform connector.  Until a few days ago, the custom connectors only supported Postman v1.0 collections.  And Postman has not save using the v1 format for a long time.  

I was happy to see the Custom connectors support v2.0 and 2.1 of postman collections.  Only problem is while it says it does if is still broken.  So I have to go the old school way.

I wanted to generate custom connectors for HMRC's REST API so that I can connect with the Power Platform.  Option 2 below gives me a way to build my collections using HMRC's API's and generate the appropriate version 2 Swagger definition.

Resolution

Option 1: 

  1. Export the postman collection in v2.1
  2. Upload the postman file to https://apitransform.com/ and generate the OpenAPI specification (version 3.0.0) gets generated.
  3. Upload the OpenAPI 3.0.0 specification file to Transformer | APIMatic and generate the JSON Open API 2.0 version.
  4. In Power Apps add a new custom connector based off the Open API file (version 2.0) to generate the connector.

The process is a pain, but this approach does not need any software installed.  I do feel Power Platform are about to improve by accepting the Postman v2 collections and it would be great if it could read Open API file in YAML and JSON in both V2.0 & 3.0 but any of these permutations would be a game changer.

Warning: Large collections end up with information being lost in the translations.

Option 2: 

  1. Export the postman collection in v2.1
  2. Upload the Postman 2.1 Collection file into Transformer | APIMatic and generate the JSON Open API 2.0 version.
  3. In Power Apps add a new custom connector based off the Open API file (version 2.0) to generate the connector.

Monday 16 August 2021

Distribute tracing using Azure Application Insights across Azure SaaS product

Overview:  Building SaaS products using multiple underlying Azure PaaS, and IaaS services with multiple Microservices supporting and calling each other is great.  The issue is we need to be able to trace, debug, and observe the logic flow through multiple Microservice calls.  Distribute Tracing on Azure supports technical players such as devOps teams, developers, support, technical leads and/or architects to find and trace the entire execution to figure our what is/has happened.  Application Insights provides rich functionality on Azure PaaS services.

Distribute Tracing:  A good option for providing consistent traceable logging is to use Application Insights with the Distributed Tracing to trace the flow of each transaction.  The original request generates an Id which is set as the operation_parentId.  Now we can easily follow the execution of a specific operation.

It is fairly easy to tie multiple operations together.  For example, an operation that fires timer jobs, each timer job would be seen as unique operations with their own full trace.  By referencing the original operation when the timer jobs are setup, long running distributed jobs can be tied together.

Thoughts:  Distributed tracing generally catches exceptions from the underlying infrastructure services such as SQL, Azure Functions, App Service on Windows but in code you can add additional tracing information.  The tracing info can be exception based but most of this is picked up anyway or trace base (when an even happens you want to record).

It is a good idea to instantiate the Telemetry client once per service e.g. webAPI and merely call using the same instantiate telemetry object instance throughout each application.

On exception in both client and Server side code write to App Insights telemetry.  Below is the C# server side code snippet:

try

{

    ...

    telemetry.TrackTrace(message, SeverityLevel.Warning, properties);

}

catch (Exception ex)

{

    telemetry.TrackException(ex);

}

More Info:

Distributed Tracing in Azure Application Insights - Azure Monitor | Microsoft Docs

Application Insights API for custom events and metrics - Azure Monitor | Microsoft Docs

Sunday 8 August 2021

Tools for Architects

Overview:  As an architect we use multiple tools, it's a good idea to standardise tool usage especially in larger businesses. It's pretty common to se architects using different tool for drawing architecture diagrams (viso, draw.io,...)

Common Drawing tool I've seen architects use:

  • Visio
  • Draw.io
  • Balsamiq (my odd tool of choice that offers low fidelity, alternatives are Figma which is high fidelity for UI and Ux design, issue is end users thing its the website and get confused, Axure is also a nice Ux prototyping tool).
  • Lucidchart (competitor products: Visio, Miro, Balsamiq, ) Lucidscall can pull diagrams from architecture.  The is also a cool python git project that allows you to specify a diagram using Python and it draws the diagram and you can also then use the Python code to provision the infrastructure.
  • Miro (great for sharing).  Similar to Lucidcharts, with good integration, I tend not to introduce Miros as I use Teams and it's whiteboarding.  FigJam is pretty good for brainstorming from the makers of Figma.
  • PowerPoint (sic. but it happens and some architects are good with it)

Tools for Retrieving Azure Architecture and creating documentation:

Enterprise Architecture Tooling:

  • Sparx
  • Archimate

Dev Tooling I use a lot:

  • Visual Studio
  • SQL Server Management Studio 
  • Postman/Swagger

WIP


Sunday 1 August 2021

JMeter - The basics

JMeter is an easy to use open source load testing tool by simulating network requests.  JMeter is good for figuring out how well the server side responses are working under different test conditions.  JMeter is built with Java and can run on Linux, Mac or Windows using a Java Virtual Machine (JVM). 


JMeter is Single Agent:

  • JMeter runs from the machine it is installed on so it does not have multiple agents.  Saying that it can simulate hundreds of users on fairly low spec machines.  
  • To avoid network latency, test on the same subnet or data center.  A simple VM in Azure (with 2 vCPU's and 8 GB RAM) can mimic over a thousand requests per second.
  • You can run tests off multiple machines to generate extreme loads (first I would use 8 cores and 64GB ram until the network traffic is maxed).
  • Install the Windows JDK 11 before installing installing JMeter.
Updated 2 May 2023: The current version of JMeter is Apache JMeter 5.5

Download and record web tests using the JMeter GUI tool.
Azure Load Testing needs the recorded tests generated by the JMeter GUI.
Create a new Azure Load Test Resource and use the recorded JMX/Test script file.


JMeter GUI
Open /bin/jmeter.bat