Overview: App Insights provides a standalone infrastructure for logging and tracing. It is tightly coupled with Azure services, including PaaS. This allows for consistent, scalable logging. App Insights now stores logs in Azure Log Analytics; these are all under the umbrella of Azure Monitor.
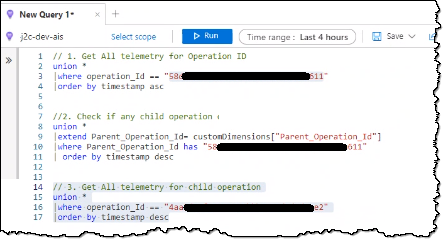
On a SaaS solution, I am looking for App Insights to log any errors and have the ability to log trace information. I want a unique correlationId (to allow for distributed tracing) on the front end if there is an error, so support can identify the exact issue/transactions. A unique correlationId in the HTTP header allows identifying a transaction, which is useful for tracing and performance monitoring. Using the App Insights SDK's and implementing a standard logging module is a good idea. Two common areas need to be called out to ensure the ability to trace transactions:
- SPA's (Requirement to generate a unique operation/correlationId per operation not per pageview), and
- Long-running operations, such as timer jobs or service bus calls.
Support & DevOps:
Having a correlationId allows the first line to log the correlationId and quickly follow the request without asking for replication steps. This context tracing approach is common in newer applications. Third-line support has full traceability of an issue to support who can empirically see the performance components broken down using the correlationId in the header.
Key APIs can be continuously monitored for errors and performance slowdowns, and alerts can be configured based on these metrics.
Building a first-line support tool that displays errors in a hierarchy, includes help scripts, and integrates a knowledge base is a good option for streamlining support.
App Insights has live monitoring, and the Kusto query language is helpful for monitoring specific queries.
Summary Report for Support
// I'm sure there are nicer ways to write/improve my Kusto, so pls let me let me know where the code can be improved
let dayminus0 = datetime(now);
let dayminus1 = ago(24h);
let dayminus2 = ago(48h);
let result0 = requests
| where timestamp > dayminus1 and timestamp < dayminus0
| summarize requestCount=sum(itemCount), avgDuration=avg(duration) by performanceBucket
| where performanceBucket == "15sec-30sec" or performanceBucket == "7sec-15sec"
or performanceBucket == "30sec-1-min" or performanceBucket == "1min-2min";
let dayminus1a = ago(24h);
let dayminus2a = ago(48h);
let result1 = requests
| where timestamp > dayminus2a and timestamp < dayminus1a
| summarize requestCount1=sum(itemCount), avgDuration1=avg(duration) by performanceBucket
| where performanceBucket == "15sec-30sec" or performanceBucket == "7sec-15sec"
or performanceBucket == "30sec-1-min" or performanceBucket == "1min-2min";
let dayminus1b = ago(2d);
let dayminus2b = ago(3d);
let result2 = requests
| where timestamp > dayminus2b and timestamp < dayminus1b
| summarize requestCount2=sum(itemCount), avgDuration2=avg(duration) by performanceBucket
| where performanceBucket == "15sec-30sec" or performanceBucket == "7sec-15sec"
or performanceBucket == "30sec-1-min" or performanceBucket == "1min-2min";
let resultTemp = result0
| join kind=inner result1 on performanceBucket
| project performanceBucket, ['Today'] = avgDuration, ['Yesterday'] = avgDuration1;
let resultTemp2 = resultTemp;
resultTemp2
| join kind=inner result2 on performanceBucket
| project
performanceBucket,
['1) Today']= (round(['Today'], -2) / 1000),
['2) Yesterday'] = (round(['Yesterday'], -2) / 1000),
['3) Two Day ago'] = (round(avgDuration2, -2) / 1000)
| render columnchart
with (
kind=unstacked,
ytitle="Seconds Taken",
xtitle="Performance Group",
title="Ensure the 'Today' bar is not significantly higher than pervious days");
Monitoring: Azure dashboards are great for monitoring application health and performance. Easy to customise, make unique dashboards and security is easy to control. sentry.io monitors API's, I have not used it. I like all the Azure stuff coming out for testing and I feel continuously running Postman collections and reporting to App Insights is the best way to go. Azure Dashboards can be limiting, Azure Grafana can be a great alternative/enhancement. Check out
Azure Managed Grafana. Alerting: I all too often see an overuse of alerting, resulting in recipients ignoring a plethora of emails. I believe in minimising alerts, primarily via email and SMS. For me, I like to create a dedicated channel for alerting that includes all DevOps members and either notify via a Teams card, or even easier, email the channel. This can be broken down further but to start I create a channel for alerting for each DTAP environment.
Note: The default channel setup only allows members of the Teams channel to send email, so the alerts from Azure Monitor using rules won't be accepted. On the channel, and admin needs to go to the "advance settings" and change the option from "Only members of this Team" and change it the setting to "Anyone can send".
Options: There are excellent logging services, so my default is Azure Monitor. All leading vendors support Open Telemetry. The leading players in Application & API observability and monitoring include:
- Open Telemetry records traces, metrics, and logs from multiple distributed systems and is open source.
- Fluent Bit Log processor and forwarder. Used to collecting, filtering, and shipping logs. More restrictive than OpenTelemetry but lightweight. Fluent Bit logs are often streamed or forwarded to OpenTelemetry loggers. Focuses on collecting, filtering, and shipping logs for smaller systems or devices.
- Microsoft: Azure Monitor includes Application Insights & Azure Log Analytics
- Dynatrace (really good if you use multicloud) or Dynatrace AWS CloudWatch, Dynatrace - Saas offering is on AWS. Can be on-prem. One Agent is deployed on the Compute i.e. VM, Kubernetes. Can import logs from other SIEMs or Azure Monitor, so you can eventually get Azure service logs such as App Service or Service Bus. Does Full stack and includes code-level and applications and infrastructure monitoring, and can show User monitoring. Dynatrace offers scalable APIs running on Kubernetes. "Davis" is the AI engine used to identify problems. Alerting is solid.
 |
| High-level Architecture |
 |
| Dynatrace Admin Monitoring |
- AWS: Amazon CloudWatch Synthetics
- AppDynamics,
- Datadog (excellent),
- New Relic,
- SolarWinds (excellent)
 |
| SolarWinds admin UI from circa 2013/2014 |
 |
| Dynatrace |


