Monday 26 October 2020

Identity Server - OAuth and OIDC

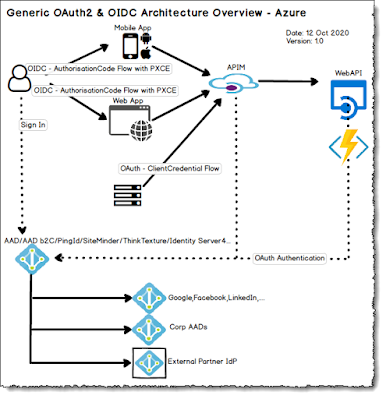
Overview:  The current version of Identity Server is 4.  Identity server is basically a .NET Core 3.1 application that is an Identify Provider (IdP) similar in role to PingId, SiteMinder, AAD b2C.  Identity server allows application (native mobile, web sites and servers) to securely authenticate users.  In this post OAuth means OAuth2.0.

OAuth2 Grant Types:

Flow Description Client Grant Type
Authorization with PK Authorization Code Grant Type.  Default choice for authorization. Native mobile Apps, Windows app, Browser Apps Code
Client Credential Server-to-server (S2S) communication also refereed to as Machine-to-machine (M2M). Server,Consoles,Services ClientCredentials
Implicit Rather use the Authorization Code Flow with PKCE Native Apps & SPA's often use Implicit Flow Implicit
Hybrid
Device
Resource Owner Pswd Don't use

Scopes: The authorisation Server specifies the "scope" that the user has consented too.  So for an API you can limit the actions the user can perform.  Scopes must be unique strings.  Recommendation is to name your scopes by the API and the Verb e.g. "pauls_api.read" is better than "read".  Scopes are used to give the user access to resources so "read" is not a good idea.  Also scopes have length limits so don't be crazy verbose in naming.

Mandatory Endpoints:  OAuth specifies 2 endpoints namely:
  1. /authorization endpoint - gets the access grant and user consent (only code and implicit flows use this endpoint)
  2. /token Endpoint - issues tokens (client credential only uses the token endpoint, obviously code & implicit flow use both endpoints)
Optional Endpoint Extensions:
  • /revoke - used to revoke a token
  • /userinfo - used to hold profile info for the user e.g. name, email.  The /userinfo endpoint is used in OIDC implementations of OAuth and specifies user must use: address, phone, email, profile in their scopes.
  • /.well-known/oauth-authorization-server - useful to discover the actual OAuth implementation.
Tokens
Access Token:
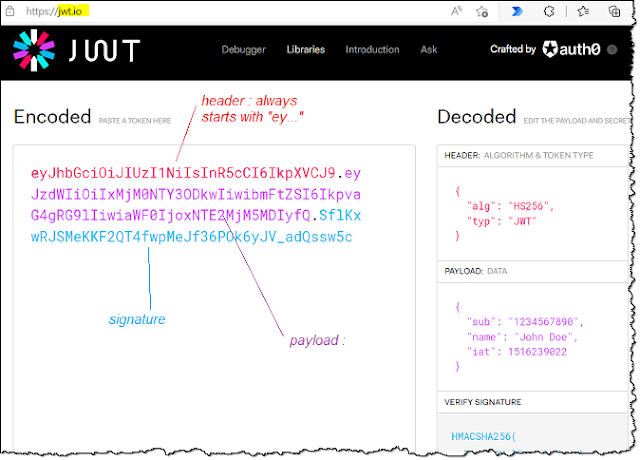
  • JSON Web Token (JWT) pronounce "JOT" is an access token that contains authorisation and profile data.  The alternative is to use Opaque to JWT but most implementations use JWT.  
  • JWT's need to be validated using the signature.  The JWT Access Token is base 64 encoded and are made up of three parts separated by period signs i.e. HEADER.PAYLOAD.SIGNATURE


Refresh Token:
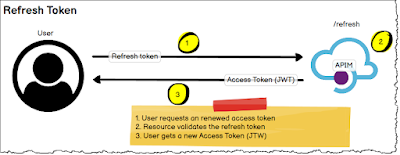
  • Refresh tokens are opaque
  • Single endpoint with a single function to get a new Access Token.


Interactive description of the OAuth Code Flow process:


Monday 19 October 2020

APIM High Availability and Performance across Regions

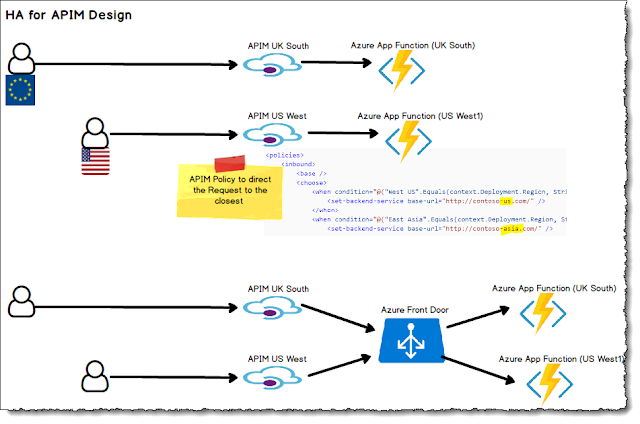
Overview:  APIM can be setup in multiple regions and incoming request will be routed to the closest APIM endpoint.  If there is only 1 APIM region, it is best to ensure the API/App Service/Function is hosted in the same region.  With multiple APIM's you can also host a API in the same region.  The routing is either done automatically using Azure Front Door or via policy on the APIM.

Front Door can be substituted with Azure WAF, or Cloudflare or Barracuda's SaaS solution.

More Info

WAF Options

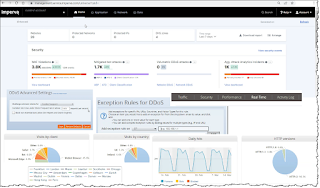
Overview:  HTTP Traffic from users to web sites and API's need to have WAF protection.  Both Azure and AWS have good services to protect your API's and applications.  There is also the option to use a dedicated WAF Services.  When protecting large organizations with hybrid cloud providers then options like Barracuda, Imperva/Encapusla, F5 and Cloudflare are good enterprise level options.  Fundamentally, a WAF sits as an intermediary between the user and the resource they are requesting using HTTP.  I like to set my highest priority rule to DENY all HTTP & HTTPS traffic, then i specifically open the rules that i want to flow thru, a lot people do it the other way around in smaller implementations.

WAF Options:
  • Azure WAF simple in 1 region for a WAF especially with APIM and if you are an Azure customer simple got for an Azure Application Gateway with WAF enabled.  DDoS is s separate service that can be integrated before Azure WAF or Azure Firewall.  Cheaper per IP SKU option for specific IP adrs.
  • Azure Front Door WAF is pretty amazing, Cloudflare is historically the leader with similar functionality.  On Microsoft Azure the main two options for WAF are Front Door WAF (Best, most expensive) and Azure Application Gateway WAF.
  • Competitor  options: Barracuda WAF SaaS Service or Any software firewall KEMP, F5, Check Point, Fortinet/Fortigate, Cloudflare WAF, Akamai, AWS WAF, AWS Network Firewall, Cloud Armor is GCPs WAF I believe, ....  
  • Check WAF service has protection at least for DDoS, XSS, SQL injection attacks, SSL Termination if you need it, Managed RuleSets.
  • AWS WAF is for web traffic (layer 7), there is a separate AWS Shield service that is used for DDos attacks.  AFS can be applied at a Application Load Balancer, Amazons API Gateway, and Amazon CloudFront.  With AWS WAF you also get Shield (standard free).  Shield adds advanced features and the standard version that is always included by default with AWS WAF has monitoring and DDoS protection.
  • Barracuda WAF is a SaaS Service that has worked fairly well for me.  Has a fair amount of options and rules.  Has add-ons like anti-virus scanning.
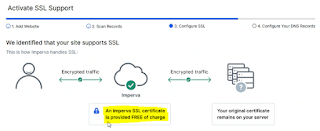
  • Imperva WAF was previously called Incapsula WAF, that provides a SaaS WAF service including Smart DDoS (block dodgy traffic and passes thru good requests), API Security, SQL injections, Xss.  Multiple data centers around the world.
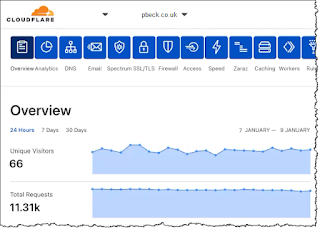
  • Cloudflare is a Secure access service edge (SASE).  Cloudflare provides a WAF service at hundreds of endpoints around the globe (for instance there are 5 Cloudflare endpoints in Australia).  WAF functionality like SSL, DDoS (L7), customer rule e.g. rate limiting, OWASP rules applied, "api protection", et al. is done close to the user request (nice low latency) and then if successful it is pushed to the backend.


Last Updated: 2022-03-15

Friday 9 October 2020

App Insights - Website and API Monitoring

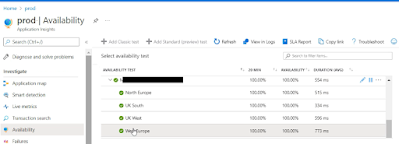
Overview:  App Insights has functionality to run scheduled web requests and log the output in App Insights.  There are multiple advantages to this including end to end active monitoring of web sites and API's, and keeping the application warm.

Below I show a simple request to my blog (public website) and the results, Azure refers to this test type as a URL Ping test which is basically a URL HTTP GET request.  


Wait a few minutes and Refresh to see the results:

Very easy way to include a constant check that your API or Website is running.  There is also the options to create "Multi-step web test" using Visual Studio.  You can record the authentication and assert for known response content to build advanced constant monitoring.

Tip: The URL does need to be publicly available.

The content I used to test out the functionality comes from the Microsoft Docs site.
Also see Live Metric Stream that is part of App Insights.

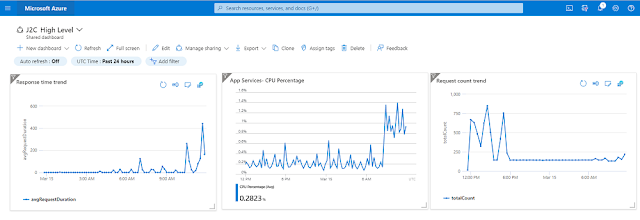
Monitoring using Azure Monitor Dashboards:
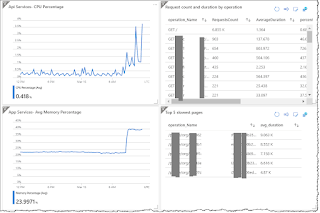
  • The image above shows a dashboard that can be used to monitor a SaaS applications PaaS Infrastructure.
  • It's a good idea to create multiple dashboards and they can show the overview and allow the user to drill into specific areas.
  • Internal boards watching key API's, HTTP uptime ping type requests is also a good idea.

Updated: 11 Jan 2023
- Checkly looks like a great monitoring service that works with Playwright for continuous monitoring.  I like to keep all my SaaS on Azure, but Checkly is independent an as it is monitoring.

More Info: 
App Insights MultiStep Tests  Replacement Option for MultiStep Test based on Azure Functions

Thursday 1 October 2020

App Insights - Basic Introduction

OverviewAzure App Insights is a great platform for collecting logs and monitoring cloud based applications on Azure.  All Azure Services can push logging information into App Insight instances.  This can be errors, usages, performances logging that in turn is easy to query.  There are SDKs for developers that can be used to add custom logging to applications.  I am a big fan of AppDynamics for logging and monitoring but for SaaS and on a new project I'd go with App Insights.

Retention:  App Insights can keep 730 days worth of logs.  For long term storage, "Continuous Export" can be used to push data into storage accounts as soon as it arrives in AppInsights.  Retaining the App Insight logs for 90 days has no additional cost, so the default to store logs should be set to 90 days at least in most situations.

What is logged and what can be logged:  
  • All Azure Services can be configured to send service logs to a specific App Insight instance.
  • Instrument packages can be added to services to capture logs such as IIS, or background services.  You can pull in telemetry from infrastructure into App insights e.g. Docker logs, system events.
  • Custom code can also call the App Insight instance to add logging and hook into exceptions handling.  There are .NET, Node.JS, Python and other SDK's that should e used to add logging, exception capturing, performance and usage statistics.

App Insights has a REST API to query the logs.  The "API Explorer" tool is awesome for querying App Insights online.  


The data below comes from Microsoft Docs.

"What kinds of data are collected?

The main categories are:

  • Web server telemetry - HTTP requests. Uri, time taken to process the request, response code, client IP address. Session id.
  • Web pages - Page, user and session counts. Page load times. Exceptions. Ajax calls.
  • Performance counters - Memory, CPU, IO, Network occupancy.
  • Client and server context - OS, locale, device type, browser, screen resolution.
  • Exceptions and crashes - stack dumps, build id, CPU type.
  • Dependencies - calls to external services such as REST, SQL, AJAX. URI or connection string, duration, success, command.
  • Availability tests - duration of test and steps, responses.
  • Trace logs and custom telemetry - anything you code into your logs or telemetry."
App Insights creates a hierarchy of requests built up from the operationId, and operation_parentId.

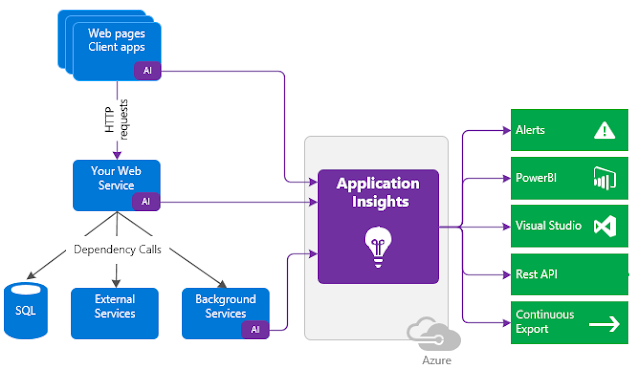
Application Insights is part of Azure Monitor and makes it easy to trace user interaction.  Independent infrastructure for recording issues and tracing.   App Insights in 3 parts. 
  • Collect: Track infra/PaaS via instrumentation (throughput, speed, response times, failure rates, exceptions etc.), and via SDK (e.g. JavaScript SDK, C#) to add custom logging and tracing.  Blue boxes
  • Store: Stores the data.  Purple Box
  • Insights: Alerts, PowerBI, live metrics, REST API.  Green Box
Extending App Insights:
For long running operations like using queues or ESB you will need to tie the operations together, and it's really easy to connect this in a hierarchy using distributed tracing.  

SPA's:  There is a JavaScript SDK but logging on SPA's needs configuration and understanding as not every operation is logged uniquely for tracing.

Smart Detection: automatically tries to quickly warn you of problems/abnormalities and there root cause.

Snapshot Debugger/profiler: VS remote debugging can be hooked to an issue.  Shows execution traces from your live app.

Transaction Search:  Easy way to query and find data or unique info.