Performance can be broken down into many aspects, in this post I examine my approach to verifying SP performance.
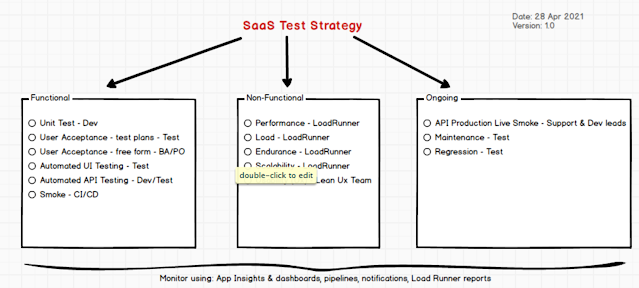
Added 2021: Breakdown for types of testing used for a SaaS solution setup on Azure PaaS.
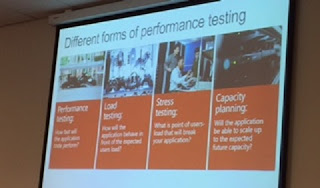 |
| Added 2015: Marcel De Vries Performance Testing Session at Dev Intersections Conference Amsterdam 2015 |
Marcel De Vries breaks it down into 4 forms of Performance Testing:
- Performance Testing
- Load Testing
- Stress Testing
- Capacity Planning
Note: Baseline each test type so that these can be compared to deployed solutions or application.
Fiddler: I create a publishing site and use fiddler from as close to the server with a minor adjustment so I can easily see the TTL. You need Fiddler and make this
adjustment (alternatively you can see this in the page response anyway). This tells me how quickly my page is being returned, you can also use this to prove if network connectivity is your issue. For instance a remote site in Asia regardless of request may have poor connectivity.
PageSpeed Insights: This is a
Google service to check the speed of your public website and provides a nice summary of items you can optimise.
Developer Dashboard: Brilliant tool and even better in SP2013. You need to
enable the developer dashboard. You can also add custom
custom monitored scopes that allow you to dive down into bottlenecks using the dev dashboard.
Visual Studio Web Tests: Available in VS2010 and VS2012, these allow you to record browser actions, replay them and validate responses.
- Create a New Visual Studio Project of Type "Web And Load Test Project", The little red icon allows you open the web browser and record the browser activity. I am using VS 2012 SP3 Ultimate Edition.
- The images below show a simple recorded web test and it being run against individual WFE's and a load balancer.
Visual Studio Load Tests: Add web tests or other tests together and create a load using TFS. You can simulate load and add multiple agents to test your farm or code works under stress. Integration, Ocded UI and Unit tests can be added to load tests but this can get fairly tricky so I find it easier to simulate load using combinations of web tests.
To create a load test, you need 1 or more web tests in the Load and web test project. Right click the project and create a new load test. Follow the wizard thru as shown below.
Run the Test and watch the performance counters on the SharePoint web, app and DB servers.
You can export the results into excel that provides detailed information about the load test.
Read More:
http://msdn.microsoft.com/en-us/library/vstudio/jj710162.aspx
http://blog.sharepointsite.co.uk/2013/07/identifying-page-load-times-using.html (Fiddler)
http://blog.sharepointsite.co.uk/2010/06/sharepoint-2010-developer-dashboard.html (Dev Dashboard)
http://blog.sharepointsite.co.uk/2011/01/developer-dashboard-custom-scoped.html (Dev dashboard & monitoring)
Update 26 Aug 2014
AlertFox is a useful tool for verifying page performance. It has multiple useful functions such as monitoring the website is up and running macros to login, perform searches. All these tasks record the time it takes and you can monitor performance from various locations such as the US or Europe.


