Showing posts with label monitoring. Show all posts

Tuesday 14 March 2023

Power Platform Logging, Monitoring, and Alerting

This post relates to a previous strategy blog post, read that first https://www.pbeck.co.uk/2023/02/setting-up-azure-application-insights.html

Overview:  Microsoft uses Azure Application Insights to natively monitor Power Apps using an instrumentation key at the app level.  To log for model driven apps and Dataverse this is a Power Platform config at the environment level e.g. UAT, Prod.

When setting up Application Insights, use the Log Analytics workspace approach and not the "Classic" option as this is being deprecated.

Power Apps (Canvas Apps): Always add the instrumentation key to all canvas apps, it is set in the "App" level within each canvas app.  Deploy solutions brings challenges with changing keys for app insights logging (unmanaged layers).

"Enable correlation tracing" feature imo. should always be turned on, it is still an experimental feature but with it off, the logging is based on a sessionid

"Pass errors to Azure Application Insights" is also an experimental feature.  Consider turning it on.

Canvas Apps have "Monitor", Model driven apps also have this ability to monitor, and Power automate has it's own monitoring

Log to App Insights (put app insights on Azure Log analytics), simple example with customDimensions/record.

Trace("My PB app ... TaxAPI.NinoSearch Error - Search - btnABC",
        TraceSeverity.Error, // use the appropriate tracing level
        {
            myappName: $"PB App: {gblTheme.AppName}",
            myappError: FirstError.Message,  // optional
            myappEnvironment: gblEnv,
            myappErrorCode: 10010,
            myappCorrelationId: GUID() // unique correlationId
        }
    );
Query the logs using kusto:
traces
| extend errCode = tostring(customDimensions["myappErrorCode"]), err = tostring(customDimensions["myappError"])
| where errCode == "100100"

Coming June 2023

Push cloud flow execution data into Application Insights | Microsoft Learn

Allows logging to tie Flows back to the calling Canvas app.  You can now do this manually but it has to be applied at all calls to or after the flow.

Below is a basic checklist of decisions to ensure you have suitable logging

Logging Checklist:

  1. Setup Azure Log Analytics (1 per DTAP env e.g. uat, prd)
  2. Get the workspace key needed for logging to Log analytics "Agents" > "Log Analytics agent instructions", copy the Workspace Id and the Secondary Key
  3. Create an Azure Application Insights per DTAP
  4. Each Canvas app needs an instrumentation key (check, have you aligned DTAP log instances with the Canvas App DTAP)
  5. Power Automate has great monitoring, but it is a good idea to setup logging for Dataverse (which shall cover model apps), done thru Power Platform Admin Studio > Environment
  6. Enable Logging Preview Feature for Canvas apps & check the power automate push cloud execution feature state.
  7. Do you have logging patterns in you Canvas app for errors, do you add tracing, and is it applied consistently?
  8. Do you have a Pattern for Power Automate runs from Canvas apps?  I like to log if the workflow errors after the call.
  9. Do you have a Pattern for Custom Connectors?
  10. Do you correlation trace Custom API (internal and 3rd party)? 
  11. Do you have a Try, Catch, Finally scope/pattern for Workflows.  How do you write to the logs, most common is to use an Azure Function with the C# SDK.  I like to use the Azure Log Analytics Connector in my catch scope to push error info into the workspace log using a custom table.
  12. Ensure all Azure Services have instrumentation keys. Common examples are Azure Functions, Azure Service Bus, API Manager, the list goes on...
  13. Do you implement custom APIM monitoring configuration?
  14. Do you use the SDK in your code (Functions etc.)?
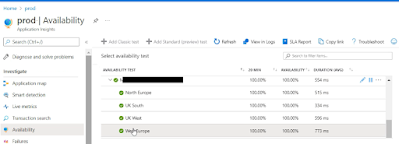
  15. Setup Availability tests - super useful for 3rd party API's.

Once you have the logs captured and traceable (Monitor & Alerting Checklist):

  1. Create Queries to help find data
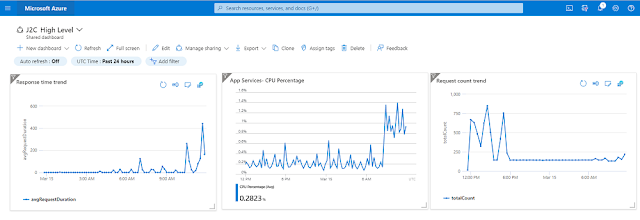
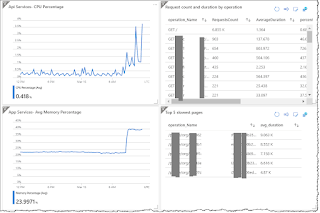
  2. Create monitoring dashboard using the data
  3. Use OOTB monitoring for Azure and the platform
  4. Consider linking/embedding to other monitors i.e. Power Automate, DevOps, Postman Monitor
  5. Setup alerting within the Azure Log Workspace using groups, don't over email.  For information alerts, send to Slack or Teams (very simple to setup a webhook or incoming email on a channel to monitor)
  6. Power Automate has connectors for adaptive cards channel messaging, consider using directly in Flows or from alerts, push the data into a flow that will log the alert using an adaptive card right into the monitoring channel.

Sunday 19 February 2023

Setting up Azure Application Insights for Monitoring Power Platform Canvas Apps

Overview: We are building key applications in Power Apps.  It is essential that the appropriate level of monitoring, alerting, and ability to trace is setup.  The diagram below provides an overview of likely solutions.  

The top half of the diagram should call out the client components used in the application, you need to add instrumentation keys to ensure the logging is done to the correct DTAP environment instance, i.e., production components used in the solution must point to the production instance of Azure Application Insights.  The diagram only deals with Production.  I prefer to point the lower env to a non-pro instance.

The bottom half discuss decisions that are key to make the monitoring and alerting successful.  It should aim to:
  1. Ensure errors are detected, 
  2. Can be traced,
  3. System is healthy, 
  4. Are any components down,
  5. Performance is stable or not,
  6. Warn me before the system goes down,
  7. Alerting is setup (don't over alert and ensure it is focused to the right people), and
  8. Validate deployments.     
I turn on the experimental features:

A gotcha to App Insights in Canvas apps applies to Managed solutions, if you add an app insights instrumentation key, or leave it blank, there is no easy way to override the value.  You can add an unmanaged layer but the issue is when you next deploy the app only updates the the new version once the unmanaged layer is removed and you will need then then manually add the Unmanaged layer after each deployment with the appropriate app insights instrumentation key.  There are workarounds with extracting the solutions and amending the setting, then repackaging using the Power Apps CLI but it has issues.


Other thoughts:
It is a good idea to use the App Insight SDK's to trace key info within each service
Power Automate should use the try catch function pattern for logging.  I log to Azure Log Analytics using the built in Power Apps connector.

Sunday 15 January 2023

Postman to verify OpenAPI's are running

Problem:  Our teams rely on a 3rd party API for a new project being delivered, the API's are in a state of change and are constantly up and down making life tough for the teams replying on the API.

Hypothesis:  I need a quick way to check the API's to see if they are all working in dev, and test.  I have two postman collections for the REST API's.  If i combine them and check the key API's using postman I can save myself and other time as I'll know the current state of the API's.

Solution: Create a site collection that does the API verification, you can make it more complex with data and variables.

Problem:  I can open Postman and run the test which takes a few minutes.  We need to do this quicker.

Hypothesis: I'd like to be able to run the tests quickly on demand.  Use postman CLI and Powershell to run the collection and display the result.

Solution

1) Add the Postman CLI to my machine:

PS> powershell.exe -NoProfile -InputFormat None -ExecutionPolicy AllSigned -Command "[System.Net.ServicePointManager]::SecurityProtocol = 3072; iex ((New-Object System.Net.WebClient).DownloadString('https://dl-cli.pstmn.io/install/win64.ps1'))"

2) In postman generate an API Key for the Collection > Run Collection > Automate runs via CLI > Generate the API Key > Copy the generated code


3) Run the code in PS to verify it works correctly.

4) Copy the PS code into a newly Created ps1 file on your local machine, I added a read line so I can see the result.


5) Run the API.ps1 file and verify the result

6) Setup a desktop short-cut to run and see the result.  Right click the API.ps1 file and create a shortcut on your desktop.  Right click and amend the target and amend the target value:

C:\Windows\System32\WindowsPowerShell\v1.0\powershell.exe -ExecutionPolicy Bypass -File C:\Users\PaulBeck\Downloads\Projects\PoC\Postman\API.ps1

7) Save and run the shortcut to verify.

Problem:  Monitor and alert DTAP API's are working and performance

Resolution: I want to monitor that my endpoints specified in my Postman collection in Dev, UAT et al. are working, can be more than 1 endpoint using Postman Monitor.

Next steps: Add to automated DevOps processes, using Newman.

Sunday 23 October 2022

Continuous Validation with Azure

I listened to Jen Perrin from Microsoft today with Scott Hasselmann on testing for Power Apps from the Ignite 2022 conference.  Chaos Studio is a tool to faking issues such as network faults, and coming backup after say 10 minutes, and it helps determine the behavior that happens.  

I have been thinking and doing continuous monitoring for awhile in SaaS products, thus can be as simple as checking you API's and SPA's are working and checking every few hours and notifying key people as early as possible.  More advanced options are running postman and/or selenium tests that run thru various tests such as login in add and cleaning up some data.  Continuous Validation is fantastic as you can perform scenarios from a specific target.

The tooling and Playwright (which i played with a few years ago) on Azure looks amazing and well suited for the Power Platform.  This is a massive area to improve software, and reliability. 

Sunday 2 January 2022

App Insights Overview for SaaS logging and tracing

Overview:  App Insights provides independent infrastructure for logging and tracing activities.  It is tightly coupled with Azure services including PaaS.  This allows for consistent scalable logging.  App Insights now stores logs in Azure Log Analytics, these are all under the umbrella of Azure Monitor, 

On a SaaS solution, I am looking for App Insights to log any errors have the ability to log trace information.  I want a unique correlationId (to allow for distributed tracing) on the front end if there is an error so support can identify the exact issue/transactions.  A unique correlationId in the http header allows for identifying a transaction and this is useful for tracing and performance monitoring.  Using the App Insights SDK's and implementing a common logging module is a good idea.  There are two common areas that need call out to ensure the ability to trace transactions:

  1. SPA's (Requirement to generate a unique operation/correlationId per operation not per pageview), and
  2. Long running operation such as timer jobs or service bus calls.

Support & DevOps:

Having a correlationId allows first line to log the correlationId and quickly follow the request without asking for replication steps.  This context tracing approach is common on newer applications. Third line support has full traceability of an issue to support who can empirically see the perceived performance parts broken down using the correlationId in the header.

Key API's can be continuously monitored for errors and slow down in performance, alerts can be configured around this monitoring. 

Building a first line support tool that displays the errors in a hierarchy, has help scripts and knowledge bases is a good option for streamlining support.

App Insights has live monitoring and also has Kusto query language is useful for monitoring specific queries.


Summary Report for Support

// I'm sure there are nicer ways to write/improve my Kusto, so pls let me let me know where the code can be improved
let dayminus0 = datetime(now);
let dayminus1 = ago(24h);
let dayminus2 = ago(48h);
let result0 = requests
    | where timestamp > dayminus1 and timestamp < dayminus0
    | summarize requestCount=sum(itemCount), avgDuration=avg(duration) by performanceBucket
    | where performanceBucket == "15sec-30sec" or performanceBucket == "7sec-15sec"
        or performanceBucket == "30sec-1-min" or performanceBucket == "1min-2min";
let dayminus1a = ago(24h);
let dayminus2a = ago(48h);
let result1 = requests
    | where timestamp > dayminus2a and timestamp < dayminus1a
    | summarize requestCount1=sum(itemCount), avgDuration1=avg(duration) by performanceBucket
    | where performanceBucket == "15sec-30sec" or performanceBucket == "7sec-15sec"
        or performanceBucket == "30sec-1-min" or performanceBucket == "1min-2min";
let dayminus1b = ago(2d);
let dayminus2b = ago(3d);
let result2 = requests
    | where timestamp > dayminus2b and timestamp < dayminus1b
    | summarize requestCount2=sum(itemCount), avgDuration2=avg(duration) by performanceBucket
    | where performanceBucket == "15sec-30sec" or performanceBucket == "7sec-15sec"
        or performanceBucket == "30sec-1-min" or performanceBucket == "1min-2min";
let resultTemp = result0
    | join kind=inner result1 on performanceBucket 
    | project performanceBucket, ['Today'] = avgDuration, ['Yesterday'] = avgDuration1;
let resultTemp2 = resultTemp;
resultTemp2
| join kind=inner result2 on performanceBucket 
| project
    performanceBucket,
    ['1) Today']= (round(['Today'], -2) / 1000),
    ['2) Yesterday'] = (round(['Yesterday'], -2) / 1000),
    ['3) Two Day ago'] = (round(avgDuration2, -2) / 1000) 
| render columnchart
    with (
    kind=unstacked,
    ytitle="Seconds Taken",
    xtitle="Performance Group",
    title="Ensure the 'Today' bar is not significantly higher than pervious days");


Monitoring:  Azure dashboards are great for monitoring application health and performance.  Easy to customise, make unique dashboards and security is easy to control.  sentry.io monitors API's, I have not used it.  I like all the Azure stuff coming out for testing and I feel continuously running Postman collections and reporting to App Insights is the best way to go.  Azure Dashboards can be limiting, Azure Grafana can be a great alternative/enhancement.  Check out Azure Managed Grafana.
source cloudiqtech

Alerting: I all to often see an overuse of alerting resulting in recipients ignoring a plethora of emails.  I believe in minimising alerts especially via email, and SMS type messaging.  For me, I like to create a dedicate channel for alerting that includes all DevOps members and either notify via a Teams card, and even easier is to email the channel.  This can be broken down further but to start I create a channel for alerting for each DTAP environment.
Note: The default channel setup only allows members of the teams channel to send email so the alerts from Azure monitor using rules won't be accepted.  On the channel, and admin needs to go to the "advance settings" and change the option from "Only members of this Team" and change it the setting to "Anyone can send".

Options:  There are great services for logging so my default tends to be Azure Monitor.  The main players in Application & API observability and monitoring include: 

  • Microsoft: Azure Monitor includes Application Insights & Azure Log Analytics
  • Dynatrace (really good if you use multicloud) or Dynatrace AWS cloudwatch,  Dynatrace - Saas offering is on AWS.  Can be on-prem.  OneAgent is deployed on the Compute i.e. VM, Kubernetes.  Can import logs from other SIEMs or Azure Monitor, so you can eventually get Azure service logs such as App Service or Service Bus.  Does Full stack and includes code-level and applications and infrastructure monitoring, also can show User monitoring.  Dynatrace offers scalable API's that are sitting on Kubernetes.  "Davis" is the AI engine used to help figure out the problems.  Alerting is solid.  
High-level Architecture

Dynatrace Admin Monitoring
  • AWS: Amazon CloudWatch Synthetics
  • AppDynamics,
  • Datadog (excellent),
  • New Relic,
  • SolarWinds (excellent)
SolarWinds admin UI from circa 2013/2014 

Dynatrace

Wednesday 8 September 2021

Observability in Azure SaaS Solutions

Problem:  Software has many places where errors and tracing is logged to.   Support get an incident, they need to investigate figure out how widespread the issue is and then try patch together various logs to figure out the problem.

Thoughts:

Observability is not a new concept, we need to be able to: 1) view and connect logs & 2) tracing and view metrics & notifications.

Implementing Observability must cover:

CI/CD allows devOps teams to find issues early using Unit testing.   Automated testing on UI.  API automation testing is also great.

Azure offers continious monitoring by performing various API calls to ensure your servie is running and any failures are picked up hopefully before any customers are aware.  You can also be notified of performance slow down, check performance speed between releases.  Which is great for identifying bottlenecks and with the Azure PaaS world, it is easy to increase the processing causing the bottleneck.  

Performance metrics built into the CI/CD and developers work allows us to identify issues early and costs miles less to correct early. 

Security and LINTing in CI/CD also allows us to pickup issues early and correct at a way lower cost.

Instrument you hardware and software, well on Azure you can use App Insights and you have a fantastic instrumenting platform that captures events.  A big reason to use Azure Services for as many of the function pieces in your solution.

Work In Progress ...

TBC Azure App Insights detail, ParentOperationId, Linking operations with a ServiceBus or work process call.


Monday 16 August 2021

Distribute tracing using Azure Application Insights across Azure SaaS product

Overview:  Building SaaS products using multiple underlying Azure PaaS, and IaaS services with multiple Microservices supporting and calling each other is great.  The issue is we need to be able to trace, debug, and observe the logic flow through multiple Microservice calls.  Distribute Tracing on Azure supports technical players such as devOps teams, developers, support, technical leads and/or architects to find and trace the entire execution to figure our what is/has happened.  Application Insights provides rich functionality on Azure PaaS services.

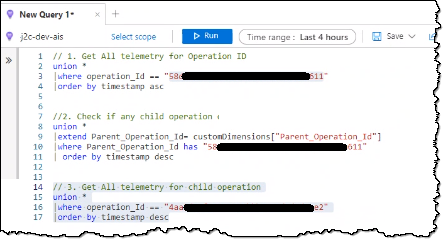
Distribute Tracing:  A good option for providing consistent traceable logging is to use Application Insights with the Distributed Tracing to trace the flow of each transaction.  The original request generates an Id which is set as the operation_parentId.  Now we can easily follow the execution of a specific operation.

It is fairly easy to tie multiple operations together.  For example, an operation that fires timer jobs, each timer job would be seen as unique operations with their own full trace.  By referencing the original operation when the timer jobs are setup, long running distributed jobs can be tied together.

Thoughts:  Distributed tracing generally catches exceptions from the underlying infrastructure services such as SQL, Azure Functions, App Service on Windows but in code you can add additional tracing information.  The tracing info can be exception based but most of this is picked up anyway or trace base (when an even happens you want to record).

It is a good idea to instantiate the Telemetry client once per service e.g. webAPI and merely call using the same instantiate telemetry object instance throughout each application.

On exception in both client and Server side code write to App Insights telemetry.  Below is the C# server side code snippet:

try

{

    ...

    telemetry.TrackTrace(message, SeverityLevel.Warning, properties);

}

catch (Exception ex)

{

    telemetry.TrackException(ex);

}

More Info:

Distributed Tracing in Azure Application Insights - Azure Monitor | Microsoft Docs

Application Insights API for custom events and metrics - Azure Monitor | Microsoft Docs

Friday 9 October 2020

App Insights - Website and API Monitoring

Overview:  App Insights has functionality to run scheduled web requests and log the output in App Insights.  There are multiple advantages to this including end to end active monitoring of web sites and API's, and keeping the application warm.

Below I show a simple request to my blog (public website) and the results, Azure refers to this test type as a URL Ping test which is basically a URL HTTP GET request.  


Wait a few minutes and Refresh to see the results:

Very easy way to include a constant check that your API or Website is running.  There is also the options to create "Multi-step web test" using Visual Studio.  You can record the authentication and assert for known response content to build advanced constant monitoring.

Tip: The URL does need to be publicly available.

The content I used to test out the functionality comes from the Microsoft Docs site.
Also see Live Metric Stream that is part of App Insights.

Monitoring using Azure Monitor Dashboards:
  • The image above shows a dashboard that can be used to monitor a SaaS applications PaaS Infrastructure.
  • It's a good idea to create multiple dashboards and they can show the overview and allow the user to drill into specific areas.
  • Internal boards watching key API's, HTTP uptime ping type requests is also a good idea.

Updated: 11 Jan 2023
- Checkly looks like a great monitoring service that works with Playwright for continuous monitoring.  I like to keep all my SaaS on Azure, but Checkly is independent an as it is monitoring.

More Info: 
App Insights MultiStep Tests  Replacement Option for MultiStep Test based on Azure Functions

Wednesday 24 June 2020

Postman API Builder Intro

Overview: Tools for building and mocking API's.  Swagger has good tooling and my original preferred choice.  APIM - Great tooling, part of Azure and easy to replace mocks as you go along with the live implementation.  Postman is offering a great set of functionality to rival Swagger and APIM.  This post looks at Postman's new functionality around building API's.

Postman API Builder:
Not only a test rig, it now offers the ability to build API's and mock:
  • Mock - so you can test supports key and OAuth authentication
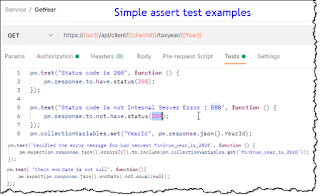
  • Assert Tests - You can specify asserts in postman
  • Test suite - generate collections/Collection Runner - Allows a set of related tests to run sequentially.
]
  • Document the API
  • Monitor
  • Version control for changes e.g. GITHub
  • API Versions supported
  • Note: Free plan has all of this, limited on the number of API's but all the features are on the free plan.  The main notation formats are support including:  Open API specification (OAS) & GraphQL
Summary:
I like Swagger tooling, I have done a few projects find APIM fantastic for building API's quickly.  Postman historically was merely my test rig but looking at the functionality, Postman API Builder is a great option for designing and building API's.  Postman is a good tool for building into CI/CD pipelines to validate API's.

Few more assert examples:

Postman offers a service to monitor API's using your postman collections, these can be triggered using Curl so can build into DevOps, Power Automated scheduled flows,....
sentry.io looks good as an alternative option

Saturday 22 February 2020

Catch Error in Power Apps and App Insight Logging

Error Handling:
App Insights logging: https://sharepains.com/2019/01/24/powerapps-experimenting-with-error-handling/  Replaced as Microsoft have built in telemetry as of 3 Feb 2020.
https://powerapps.microsoft.com/en-us/blog/log-telemetry-for-your-apps-using-azure-application-insights/

Example Error capturing and tracing to Azure AppInsights:
IfError( // Perform API Call , // Fallback so log here! ,
    Trace("Pauls Unique PowerApp",TraceSeverity.Error, {UserName:User().Email,         Role:gblRole, ErrorMsg:ErrorInfo.Message, ErrorControl:ErrorInfo.Control,         ErrorProperty:ErrorInfo.Property});     Notify("Err message ..." & ErrorInfo.Message); // Display the error on the UI
More detail..

Possible Canvas Apps Error Handling Pattern:
  1. Ensure AppInsights key is added to each canvas app
  2. Use IfError() to check calls and logic
  3. Use the Trace method to write info to App Insights
  4. Do I want to enable the Experimental error handling features (great to trace by correlationId)
  5. Consider all Power Automate that use Power Apps (ensure you use the V2 Connector)
  6. Never use IfError to handle business logic
To Review your App Insights Logging:
Open you Azure Portal > Open your App Insights blade >
Click the "Search" navigation option > Free text entry e.g. "Loyalty PowerApp"
App Insights, finding Traces generated in Power Apps

Monitoring Tool within Power Apps

The Monitor tool in Power Apps is great for debugging and tracing.
Start a monitor on the open Power App.

Monitor Tool - Showing a GET via a custom Connector and the returned response

Function/Code Logging:
Server-side code should log to App Insights or you logging framework.
It is ideal with the Trace within Power Apps explained above to be used in conjunction with 3rd party API calls.

Overview: C# code needs to have logging. If an error occurs an appropriate response must be bubbled up for the next lay

Possible C# Error Handling Pattern:

  1. All catch write exception to Log analytics or App insights 
  2. Calls to data sources, Azure Services and third party API's and complex logic ideally should be wrapped in a try catch and log the error to App insights using the C# App Insights SDK 
  3. The catch blocks ideally return the failed information so the caller code can deal with the logic using the output.  If you don't deal with the returned message, simply log the exception and rethrowing the error (this needs to be a conscious decision on each catch) 
  4. Catch specific errors: log, if you don't pass info to caller rethrow the error if applicable (bubble), respond accordingly i.e. catch the specific error and lastly use a catch all. - Heavy, but only add to existing code where this happens often or we are having problems, i.e. be specific
  5. Don't use Try, Catch to deal with business logic

Thought: Bubble up means: Code must log exceptions and returns appropriate reply to the caller, if you don't send the appropriate reply rethrow the exception after logging it so the caller has to deal with it.


Wednesday 31 January 2018

Looking for a cheap quick UI testing and monitoring Tool - end test and Ghost Inspector Review

Problem:  My client is looking for a simple tool to monitor a website is up and running and can run a small set of UI tests and asserts to verify it is working as expected.

Initial Hypothesis:  There are a lot of monitoring sites like uptime that meet this requirement, but I reviewed Ghost Inspector and endtest.  I am not looking to do full CI as I would look at Selenium WebDriver for an enterprise solution for UI testing.

Resolution:  Trial endtest and Ghost inspector on my O365 subscription to validate it monitors and alerts, can perform advanced logins and it can validate custom pages after JavaScript injection.  Price and feature wise both tools are pretty similar.

Ghost Inspector Initial Thoughts
Easy to use and there is a recording function for Chrome.  This review has put me off Ghost Inspector to some degree but definitely an excellent product to evaluate.
Bad review for Ghost Inspector but it does assume enterprise level UI testing more suited to tooling like Selenium.

endtest Initial Thoughts
Easy to use, setup testing in a matter of minutes, recorded actions and assertions.  The trial is limited as I could not check the scheduling mechanism, but end test looks like the ideal tool for my requirement.  Would need to go for the pro licence at $79 per month.  A simpler smaller option would be more attractive but let's see what the client thinks.

Other Tools for UI Testing:
Selenium
Selenium IDE is an excellent tool for UI testing and UI automation testing.  Here is a post on Selenium I did a few years back.

qTest Explorer
This is a Manual recording and documentation tool that records browser and desktop interaction.  It's straightforward to use and great for Manual UI testing.  It is not for automation or re-running test but great if the project requires manual testing and proof.


Thursday 28 August 2014

Monitoring SharePoint Public Websites

Overview:  This post is applicable to public website and not just SharePoint, I have used it for SharePoint and feel it is a good product.  The principle will apply to other monitoring products and services.

AlertFox is a SaaS monitoring service.  It allows me to monitor various websites using http posts or complicate macros to perform various steps such as logging into a website using ACS.  This differs from an internal monitoring service such as Solar Winds but it definitely has it's place.  I discuss various monitoring options in this post.

The benefits are:
  1. You are notified when the site is down and what the issue is from a web request point of view.
  2. You are monitoring externally so you can see what you customers see.
  3. You can see if your response time are slowing down.
  4. You keep the IIS webservers warmed up (so if you have an app pool recycle).
  5. Easy to monitor and you can setup alerts.
  6. Complex scenarios can be accounted for in testing so you know the complex parts of your site are working.
Image 1. See when you have problems, what the issue is and when it occurred.


Image 2. Verify the performance from around the world

Image 3. Check uptime


Thursday 31 October 2013

Monitoring SharePoint 2013

Overview: SharePoint farms have several dependencies so to effectively monitor your farm there are a lot of components to review.  Basically there are 2 forms of monitoring: Preventative & Reactive.  Also see my post on performance monitoring SP 2013.

Preventative Monitoring: is reviewing your SharEPoint estate to try identify issues before they occur.  A simple example would be identifying that your database is running out of storage space allowing you to remediate before the system fails.

Reactive Monitoring: is ensuring you are notified as early as possible so you can identify the root cause and fix with minimal downtime.  This can be a simple as waiting for the help desk to escalate that the farm is down.  In maturing this a simple set of web requests that alert the administrators as soon as a service is down is an improvement.

Monitoring needs to be a combination of preventative and reactive monitoring done via automation and manual verification.  As the automation piece improves, there is less reliance on the manual monitoring.

Tooling:
There are a wealth of tools such as SolarWinds and it's competitors "Enterprise IT management from such vendors as CA Technologies (UniCentre), BMC, IBM (Tivili), and Hewlett-Packard (OpenView)."  Wikipedia

SolarWinds Monitoring Screen

Idera have monitoring tools specifically for SharePoint.  SolarWinds is a good option for monitoring SP farms and its dependencies: Windows OS, Machine resources, SQL, SP, WCA/Office Web Apps.  Couple this with web monitoring and you get a comprehensive reactive and preventative monitoring solution.  This will tell you before collapse if the server, OS, SQL or SP is slowing down or running out of resources.  If any or a complete service stop occurs the operations team are notified and it is highlighted where the error is as opposed to "it's not working".

AvePoints, DocAve 6 has a solid monitoring tool for SharePoint and the servers so if you already have DocAve this would be my choice.  The UI gets jumbled on big farms but overall the tool is easy to use and does a solid job.

Metalogixs Diagnostics Manager looks like a nice tool.  Very similar to the DocAve Monitor but you don't need to deploy as any pieces onto the farm.  The UI can be a bit busy but definitely a product to look at.
Metalogix's Diagnostic Manager sample screen shots

Other tools include ExtraHops traffic Monitor, by check how long response takes it determines with minimal interference how well the components/nodes in the infrastructure are performing.  DocAve 6.3 has a good monitoring solution specific to SharePoint, it will monitor down to the OS and report on CPU and Memory.

AlertFox is a monitoring service (SaaS).  It can perform http get requests at regular intervals (e.g. every 5 minutes).  This ensures your webservers stay warm, measures the response time from various location around the world and can check the speed of multistep actions such as loging into your web site and performing a search.  There are a lot of these but AlertFox is good.  It has dashboard, email and sms notification included. 

SharePoint Best Practices Analyser - CA > Monitor > Health Analyser provides a good place to see common problems.

EventViewer & ULS are also good places to do reactive and even preventative monitoring however these logs will need to be trawled manually.

Key items to monitor for me are:
1.> OS/VM: CPU, OS Memory, OS disk capacity/utilsation.
2.> Windows Services: Each role needs a set of services, so your monitoring tool can verify they are working.  An example for SharePoint servers services are shown in appendix A.  If you have agents such as DocAve from AvePoint, verify these are running.  Office Web Apps 2013's service is WACSM.
3.> SQL Server: Verify the services are running, monitor SQL performance ...
4.> SharePoint: Verify web requests are returning results and measure TTL, this may indicate a bottleneck is starting to occur.  If you are using multiple front end servers, check each server is working.

Appendix A. SharePoint 2013 Services to Monitor

WFE & APP Roles
Service
Name
Status
Startup Type
Log On As
SharePoint Administration
SPAdminV4
Started
Automatic
Local System
SharePoint Search Host Controller
SharePointSearchHostController
 
Disabled
Network Service
SharePoint Server Search 15
OSearch15
 
Disabled
Local System
SharePoint Timer Service
SPTimeV4
Started
Automatic
Demo\Sp_farm*
SharePoint Tracing Service
SPTraceV4
Started
Automatic
Demo\Sp_Service*
SharePoint User Code Host
SPUserCodeV4
 
Disabled
Demo\Sp_farm*

Search Role
Service
Name
Status
Startup Type
Log On As
SharePoint Administration
SPAdminV4
Started
Automatic
Local System
SharePoint Search Host Controller
SharePointSearchHostController
Started
Automatic
Demo\SP_SearchService
SharePoint Server Search 15
OSearch15
Started
Manual
Demo\SP_SearchService
SharePoint Timer Service
SPTimeV4
Started
Automatic
Demo\Sp_farm*
SharePoint Tracing Service
SPTraceV4
Started
Automatic
Demo\Sp_Service*
SharePoint User Code Host
SPUserCodeV4
 
Disabled
Demo\Sp_farm*