Overview: Pendo tracks usage and has a help/html wizard to help users work on your application via product analytics.


Info: Pendo can be implemented using Google Tag Manager.

Overview: Pendo tracks usage and has a help/html wizard to help users work on your application via product analytics.
Azure Boards are used for managing software projects. Regardless of the approach Azure Boards support multiple frameworks and integrate well with tooling such as Visual Studio as you IDE. Microsoft strap line for Azure Boards is "Plan, track and discuss work across your teams".
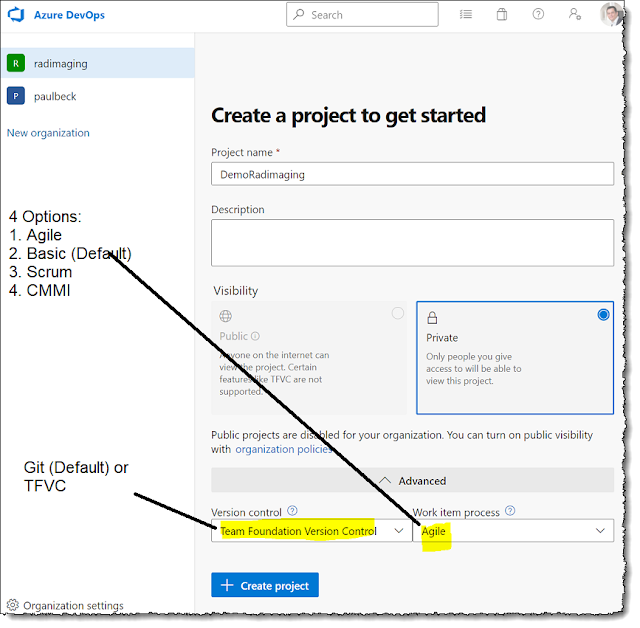
You need to login to Azure DevOps and Create an Organisation, in the image below I have two organisation.
Next I need to create a new project, the image below shows the options. For Source Control most teams and people choose Git, I came from TFS which is now Team Foundation Version Control and before that Visual Source Safe with various other version control systems but Git is now far more widely used. I have chosen to make my project "Private". Lastly, I need to select the Work Item Process. I prefer to use the "Agile" process templates for Scrum and not the Scrum Templates as I prefer to use User Stories over Product Backlog Items (PBIs) in my Backlog. I follow the hierarchy Epic, Feature, User Story, Task. And the "Agile" Template gives the correct naming and board in DevOps.
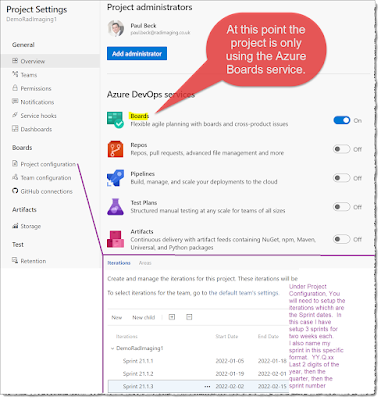
There is a little configuration to get your queries and boards setup correctly.
Azure DevOps Series Posts:
Overview: App Insights provides a standalone infrastructure for logging and tracing. It is tightly coupled with Azure services, including PaaS. This allows for consistent, scalable logging. App Insights now stores logs in Azure Log Analytics; these are all under the umbrella of Azure Monitor.
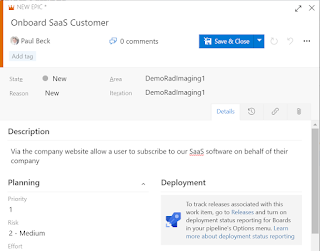
On a SaaS solution, I am looking for App Insights to log any errors and have the ability to log trace information. I want a unique correlationId (to allow for distributed tracing) on the front end if there is an error, so support can identify the exact issue/transactions. A unique correlationId in the HTTP header allows identifying a transaction, which is useful for tracing and performance monitoring. Using the App Insights SDK's and implementing a standard logging module is a good idea. Two common areas need to be called out to ensure the ability to trace transactions:
Support & DevOps:
Having a correlationId allows the first line to log the correlationId and quickly follow the request without asking for replication steps. This context tracing approach is common in newer applications. Third-line support has full traceability of an issue to support who can empirically see the performance components broken down using the correlationId in the header.
Key APIs can be continuously monitored for errors and performance slowdowns, and alerts can be configured based on these metrics.
Building a first-line support tool that displays errors in a hierarchy, includes help scripts, and integrates a knowledge base is a good option for streamlining support.
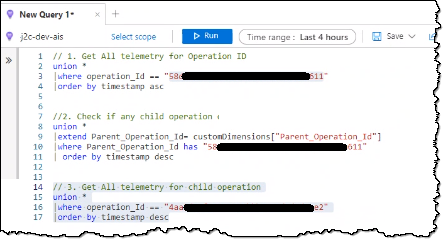
App Insights has live monitoring, and the Kusto query language is helpful for monitoring specific queries.

 |
| source cloudiqtech |
Alerting: I all too often see an overuse of alerting, resulting in recipients ignoring a plethora of emails. I believe in minimising alerts, primarily via email and SMS. For me, I like to create a dedicated channel for alerting that includes all DevOps members and either notify via a Teams card, or even easier, email the channel. This can be broken down further but to start I create a channel for alerting for each DTAP environment.
Note: The default channel setup only allows members of the Teams channel to send email, so the alerts from Azure Monitor using rules won't be accepted. On the channel, and admin needs to go to the "advance settings" and change the option from "Only members of this Team" and change it the setting to "Anyone can send".
Options: There are excellent logging services, so my default is Azure Monitor. All leading vendors support Open Telemetry. The leading players in Application & API observability and monitoring include:

 |
| High-level Architecture |
 |
| Dynatrace Admin Monitoring |
 |
| SolarWinds admin UI from circa 2013/2014 |
 |
| Dynatrace |
Azure DevOps is a SaaS platform that provides tools for deploying software using DevOps techniques generally within Agile software delivery projects. DevOps is useful for gathering requirements, building the solution, performing daily “integration builds”, and having deliverable end-of-sprint demos. The key to building software today versus several years ago is that we should automate as much as possible. Azure DevOps provides excellent tooling to automate and implement automation results in better quality, reduced timelines. Building software is easy as long as you have great people and precise requirements. Agile practices and DevOps processes and tooling can help get you to the desired state.
Azure DevOps Series Posts:
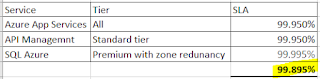
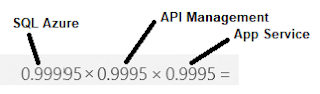
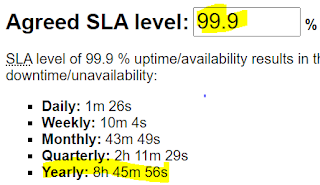
Overview: Buyers, whether B2B or B2C, will likely want to understand your licensing, associated costs, and level of service. Keep it simple, keep it understandable, and make sure you cover what availability, performance, and actions users can use your service for are all clearly outlined in your Service Level Agreement (SLA).
Licensing pricing options: Pay-per-use one-off, yearly, pay-per-user monthly or annual, pay-per-consumption, e.g., Stripe.
SLA:


Problem: I am provisioning a new team inside my tenant using Power Apps. The code throws an error and I can't get the TeamId, however, the Team is being created.

Hypothesis: The call creates the team and using the Monitoring Tool inside Power Apps I can see the call is working. The issue appears to be when Power Apps reads the response.
Possible Resolutions:

Here are a few pointers when asking for Gender, Sex, Pronouns and Users Title

