Sunday 9 January 2022

Azure DevOps Series - Azure Pipelines

Azure Pipelines are good at deploying solutions by setting up the infrastructure (I prefer to use PaaS and get out of the Infrastructure world, using ARM templates) and deploying code with the appropriate DTAP environment configuration.  Azure Test Plans are used to verify builds. 

Overview: DevOps allows for shorter duration periods to deploy code into production.  Some industries still require a high amount controlled environment code changes, think medical systems.  In the PaaS world with DevOps pipelines automation of code and verification is drastically reduced.

It's key to figure out your DTAP deployment strategy.  I outline a mixture of an old school deployment strategy with a PaaS DevOps model that is fairly risk adverse below:

This PaaS approach requires three types of pipelines:

  1. PaaS Infrastructure - One-offs and updates
  2. Build/App Deployments
  3. Database data or Schema (Bounded Context) updates 
Build agents
The instructions from Azure pipelines requires agents to run the instructions.  The easiest is to use MS host pipelines/agents.  If you need more power or software, use self hosted agents, these can be on VM's or hosted in docker containers.  It's a good idea to ensure the build agents are running the latest version as it doesn't change often. Self host if you need to run software that is not part of the MS hosted agent set.  V3 of the agent is excellent, try use this first until you outgrow it, or have specific timing concerns.

Azure DevOps Series Posts:

  1. Azure DevOps Series - Overview 
  2. Azure DevOps Series - Azure Boards 
  3. Missing
  4. Azure DevOps Series - Azure Pipelines (This Post)
  5. Azure DevOps Series - DevSecOps


Pendo Introduction - Track user interaction

Overview: Pendo tracks usage and has a help/html wizard to help users work on your application via product analytics.  


Info: Pendo can be implemented using Google Tag Manager.

Wednesday 5 January 2022

Azure DevOps Series - Azure Boards

Azure Boards are used for managing software projects.  Regardless of the approach Azure Boards support multiple frameworks and integrate well with tooling such as Visual Studio as you IDE.  Microsoft strap line for Azure Boards is "Plan, track and discuss work across your teams".

You need to login to Azure DevOps and Create an Organisation, in the image below I have two organisation.  

Next I need to create a new project, the image below shows the options.  For Source Control most teams and people choose Git, I came from TFS which is now Team Foundation Version Control and before that Visual Source Safe with various other version control systems but Git is now far more widely used.  I have chosen to make my project "Private".  Lastly, I need to select the Work Item Process.  I prefer to use the "Agile" process templates for Scrum and not the Scrum Templates as I prefer to use User Stories over Product Backlog Items (PBIs) in my Backlog.  I follow the hierarchy Epic, Feature, User Story, Task.  And the "Agile" Template gives the correct naming and board in DevOps.  


Go to "Project Setting" > "Project Configuration" and update the iterations to match your sprint dates as shown below.

Add a new Epic (Top level Item)


There is a little configuration to get your queries and boards setup correctly.

Azure DevOps Series Posts:

  1. Azure DevOps Series - Overview
  2. Azure DevOps Series - Azure Boards (This Post)
  3. Missing
  4. Azure DevOps Series - Azure Pipelines
  5. Azure DevOps Series - DevSecOps

Sunday 2 January 2022

App Insights Overview for SaaS logging and tracing

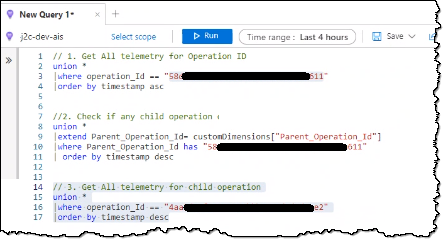
Overview:  App Insights provides independent infrastructure for logging and tracing activities.  It is tightly coupled with Azure services including PaaS.  This allows for consistent scalable logging.  App Insights now stores logs in Azure Log Analytics, these are all under the umbrella of Azure Monitor, 

On a SaaS solution, I am looking for App Insights to log any errors have the ability to log trace information.  I want a unique correlationId (to allow for distributed tracing) on the front end if there is an error so support can identify the exact issue/transactions.  A unique correlationId in the http header allows for identifying a transaction and this is useful for tracing and performance monitoring.  Using the App Insights SDK's and implementing a common logging module is a good idea.  There are two common areas that need call out to ensure the ability to trace transactions:

  1. SPA's (Requirement to generate a unique operation/correlationId per operation not per pageview), and
  2. Long running operation such as timer jobs or service bus calls.

Support & DevOps:

Having a correlationId allows first line to log the correlationId and quickly follow the request without asking for replication steps.  This context tracing approach is common on newer applications. Third line support has full traceability of an issue to support who can empirically see the perceived performance parts broken down using the correlationId in the header.

Key API's can be continuously monitored for errors and slow down in performance, alerts can be configured around this monitoring. 

Building a first line support tool that displays the errors in a hierarchy, has help scripts and knowledge bases is a good option for streamlining support.

App Insights has live monitoring and also has Kusto query language is useful for monitoring specific queries.


Summary Report for Support

// I'm sure there are nicer ways to write/improve my Kusto, so pls let me let me know where the code can be improved
let dayminus0 = datetime(now);
let dayminus1 = ago(24h);
let dayminus2 = ago(48h);
let result0 = requests
    | where timestamp > dayminus1 and timestamp < dayminus0
    | summarize requestCount=sum(itemCount), avgDuration=avg(duration) by performanceBucket
    | where performanceBucket == "15sec-30sec" or performanceBucket == "7sec-15sec"
        or performanceBucket == "30sec-1-min" or performanceBucket == "1min-2min";
let dayminus1a = ago(24h);
let dayminus2a = ago(48h);
let result1 = requests
    | where timestamp > dayminus2a and timestamp < dayminus1a
    | summarize requestCount1=sum(itemCount), avgDuration1=avg(duration) by performanceBucket
    | where performanceBucket == "15sec-30sec" or performanceBucket == "7sec-15sec"
        or performanceBucket == "30sec-1-min" or performanceBucket == "1min-2min";
let dayminus1b = ago(2d);
let dayminus2b = ago(3d);
let result2 = requests
    | where timestamp > dayminus2b and timestamp < dayminus1b
    | summarize requestCount2=sum(itemCount), avgDuration2=avg(duration) by performanceBucket
    | where performanceBucket == "15sec-30sec" or performanceBucket == "7sec-15sec"
        or performanceBucket == "30sec-1-min" or performanceBucket == "1min-2min";
let resultTemp = result0
    | join kind=inner result1 on performanceBucket 
    | project performanceBucket, ['Today'] = avgDuration, ['Yesterday'] = avgDuration1;
let resultTemp2 = resultTemp;
resultTemp2
| join kind=inner result2 on performanceBucket 
| project
    performanceBucket,
    ['1) Today']= (round(['Today'], -2) / 1000),
    ['2) Yesterday'] = (round(['Yesterday'], -2) / 1000),
    ['3) Two Day ago'] = (round(avgDuration2, -2) / 1000) 
| render columnchart
    with (
    kind=unstacked,
    ytitle="Seconds Taken",
    xtitle="Performance Group",
    title="Ensure the 'Today' bar is not significantly higher than pervious days");


Monitoring:  Azure dashboards are great for monitoring application health and performance.  Easy to customise, make unique dashboards and security is easy to control.  sentry.io monitors API's, I have not used it.  I like all the Azure stuff coming out for testing and I feel continuously running Postman collections and reporting to App Insights is the best way to go.  Azure Dashboards can be limiting, Azure Grafana can be a great alternative/enhancement.  Check out Azure Managed Grafana.
source cloudiqtech

Alerting: I all to often see an overuse of alerting resulting in recipients ignoring a plethora of emails.  I believe in minimising alerts especially via email, and SMS type messaging.  For me, I like to create a dedicate channel for alerting that includes all DevOps members and either notify via a Teams card, and even easier is to email the channel.  This can be broken down further but to start I create a channel for alerting for each DTAP environment.

Note: The default channel setup only allows members of the teams channel to send email so the alerts from Azure monitor using rules won't be accepted.  On the channel, and admin needs to go to the "advance settings" and change the option from "Only members of this Team" and change it the setting to "Anyone can send".

Options:  There are great services for logging so my default tends to be Azure Monitor.  The main players in Application & API observability and monitoring include: 

  • Microsoft: Azure Monitor includes Application Insights & Azure Log Analytics
  • Dynatrace (really good if you use multicloud) or Dynatrace AWS cloudwatch,  Dynatrace - Saas offering is on AWS.  Can be on-prem.  OneAgent is deployed on the Compute i.e. VM, Kubernetes.  Can import logs from other SIEMs or Azure Monitor, so you can eventually get Azure service logs such as App Service or Service Bus.  Does Full stack and includes code-level and applications and infrastructure monitoring, also can show User monitoring.  Dynatrace offers scalable API's that are sitting on Kubernetes.  "Davis" is the AI engine used to help figure out the problems.  Alerting is solid.  
High-level Architecture

Dynatrace Admin Monitoring
  • AWS: Amazon CloudWatch Synthetics
  • AppDynamics,
  • Datadog (excellent),
  • New Relic,
  • SolarWinds (excellent)
SolarWinds admin UI from circa 2013/2014 

Dynatrace

Thursday 30 December 2021

Azure DevOps Series - Overview

Azure DevOps is a SaaS platform that provides tools for deploying software using DevOps techniques generally within Agile software delivery projects.  DevOps is useful for gathering requirements, building the solution, performing daily “integration builds”, and having deliverable end-of-sprint demos.  The key to building software today versus several years ago is that we should automate as much as possible.  Azure DevOps provides excellent tooling to automate and implement automation results in better quality, reduced timelines.  Building software is easy as long as you have great people and precise requirements.  Agile practices and DevOps processes and tooling can help get you to the desired state.

  1. Azure Boards are great for planning and getting the requirements cleanly broken down.
  2. Visual Studio coupled with Azure boards items with Azure Repos (source control options are GitHub & TFVS) is ideal for the development using most languages such as C#, NodesJS, Angular, React, TypeScript.
  3. Azure Pipelines are good at deploying solutions by setting up the infrastructure (I prefer to use PaaS and get out of the Infrastructure world, using ARM templates) and deploying code with the appropriate DTAP environment configuration.  Azure Test Plans are used to verify builds. 
  4. Monitor and Alert – Azure Monitor/App Insights is ideal for monitoring the infrastructure and operating code to detect issues early.
  5. Azure Artifacts help create and share Nuget code packages.

More Info:

Sunday 7 November 2021

Figuring out SaaS licencing and SLA's

Overview: Buyers be they B2B or B2C will want to understand you licensing, probably cost, and level of service.  Keep it simple, keep it understandable, make sure you cover what availability, performance, actions users can use you service for are all clearly outlined in you Service Level Agreement (SLA).

Licensing pricing options:  Pay per use one-off, yearly, pay per user monthly or annual, pay per consumption e.g. stripe.  

SLA:

  • Availability 99.9 or better is good, it really depends on what you are offering but there are often penalties for missing availability SLA.  If I build a pretty standard SaaS application that utilises App Services, APIM (standard, premium geo loaded has a higher SLA) and Azure SQL, I can't make a 99.9% SLA excluding AAD and any patching, or application caused downtime.  At a SaaS product level providing an actual 99.999% (5 nines) SLA is not as easy as the marketing and legal stakeholders might assume.

It becomes easier to offer 99.9+% SLA's if you as a company assume the risk.  i.e it's unlikely all the downtime will occur and affect you sequentially so offering money back is absolutely possible.  Also most SaaS companies require clients to claim, it is not monitored and automatically applied to your bill.
  • Support - phone, bot, email and max time to respond and time to resolve.  
  • B2B Monitoring - Good idea to monitor you SaaS provider and not just take their word for it.  Technically, monitor availability of individual services (web sites or API's), it also good to know when items outside of your control (with the SaaS vendor) are unavailable in internal support.  Examples: page load times, login times, you are looking for availability and speed.   How much of the service is down, how much does this affect end customers.   You may want to use a 3rd party tool or write your own as a last resort to monitoring.  When relying on 3rd parties to provide services ensure you do a hazard risk assessment.  Plan for when things happen, how will you respond, adjust.

SLA vs SLO vs SLI:
  • SLA (Servcie Level Agreement - contractual agreement SaaS company makes with the customer.
  • SLO  (Service Level Objective) - Goal availability (and acceptable performance) of the microservice or application.  Measurement goal.
  • SLI (Service Level Indicator) - checks if SLO is achieved.  Actual Measurement.

As part of High Availability and scalability, it is a good idea to know how many instances and how autogrowth is setup, here is an example for Azure App Services.


Scale Out (CPU or Memory) - Matrix Threshold (Avg): 70, Duration:  5 Min, Cool down Time:  5 Min, Increase Count: 1
Scale In   (CPU or Memory) - Matrix Threshold (Avg): 40, Duration: 30 Min, Cool down Time: 10 Min, Decrease Count: 1

Power Apps - MicrosoftTeams.CreateATeam() connector method not working

Problem:  I am provisioning a new team inside my tenant using Power Apps.  The code throws an error and I can't get the TeamId, however, the Team is being created.


Hypothesis:  The call creates the team and using the Monitoring Tool inside Power Apps I can see the call is working.  The issue appears to be when Power Apps reads the response.

Possible Resolutions:  

  1. Use Power Automate and fire from the Power App
  2. Create a custom Postman Collection using the Teams Graph API